Ne’eman Bakery survey: Cheese beats pizza as favorite boreka
On the occasion of the country's 76th Independence Day, we set out to check which borekas the public loves most. Which bread is more likely to be found in our house, white or dark. Which yeast cake stars the most at our guest table and which cookie do we like best with coffee? And how does the ongoing stress of the war affect the consumption of carbohydrates in Israel?!
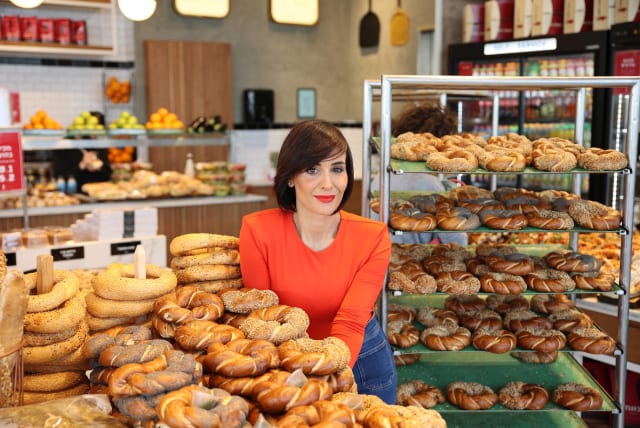
The Ne'eman Bakery chain, which has been leading the world of bread, pastries and desserts in Israel for decades and is celebrating its 80th anniversary, yes, even before the establishment of the state, decided on the occasion of the 76th celebration of the State of Israel to reveal the data on the purchases and preferences of the Israeli public from the chain's 63 branches spread throughout the country, from north to south and to determine unequivocally, what is the most loved carbohydrate, which categories are the most purchased and what are the consumption habits and taste of the Israelis and how the war affects the consumption of carbohydrates in Israel.
The tested categories are the leading ones in the branches and reflect the "shopping cart" of the average consumer. The results reflect purchases measured for an entire year from all branches of the chain throughout the country, according to prominent categories and characterization of flavors from each category and purchases in percentages.
")
The most prominent and purchased categories are borekas, breads, dry cookies, yeast cakes, and pound cakes.
Mimi Ne’eman, an owner of the bakery chain, says: "There is no doubt that the people of Israel love carbohydrates and bread. Pastry and bread (in particular) has been a basic consumer product since the dawn of history and are now found in every home in Israel, in a variety of configurations: bread, borekas, cookies, cakes, and more. Every year there are new flavors and combinations of flours and toppings that allow development in the bakery industry, with a variety of rich, delicious, and particularly exciting collections. As a chain that has existed for decades, we see a trend from the analysis of the data in the chain since the beginning of the war. It is known that stress increases the levels of hunger hormones such as cortisol and ghrelin in the body - which produce a feeling of hunger and a need for comfort food, and this affects the consumption and choice of carbohydrates and sweet carbohydrates in particular in the nutritional menu in the daily routine."
")
The full results of the survey are:
Boreka flavors:
- Cheese 36%.; 2. Potato 20%.; 3. Pizza 14%.; 4. Borekitas 13%; 5. Spinach 8%.; 6. Additional flavors 9%.
General bread categories (different types):
- Classic (finger) rolls 33%.; 2. Pitas 20%.; 3. Pretzels 15%.; 4. Braided buns 8%.; 5. Other types of bread 7%.
Breads:
- Black bread 30%.; 2. Whole rye bread 22%.; 3. Olive bread 20%.; 4. White bread 13%.; 5. Nut bread 12%.; 6. Other types 3%.
Dry cookies:
- Biscotti 27%.; 2. Alfahores 24%.; 3. Date cookies 16%.; 4. Jam 14%.; 5. Sesame seeds 12%.; 6. Additional flavors 7%.
Yeast cakes:
- Chocolate 28%.; 2. Cheese 20%.; 3. Cinnamon 18%.; 4. Halva 14%.; 5. No filling 12%.; 6. Additional flavors 8%.
Pound cakes:
- Chocolate muffins 24%.; 2. Halva 22%.; 3. Cream cheese 20%.; 4. Nougat 17%.; 5. Marble is 11%.; 6. Additional flavors 6%.
This article was written in cooperation with Ne’eman Bakery
Jerusalem Post Store
`; document.getElementById("linkPremium").innerHTML = cont; var divWithLink = document.getElementById("premium-link"); if (divWithLink !== null && divWithLink !== 'undefined') { divWithLink.style.border = "solid 1px #cb0f3e"; divWithLink.style.textAlign = "center"; divWithLink.style.marginBottom = "15px"; divWithLink.style.marginTop = "15px"; divWithLink.style.width = "100%"; divWithLink.style.backgroundColor = "#122952"; divWithLink.style.color = "#ffffff"; divWithLink.style.lineHeight = "1.5"; } } (function (v, i) { });